March 17, 2026

California produces 80% of U.S. wine across 4,800+ bonded wineries, generating $170B+ in economic impact. Napa Valley alone contributes $8.2B annually. But rising temperatures, shrinking water supplies, and intensifying wildfires are rewriting the story; backed by 50+ years of vineyard data, satellite monitoring, and harvest records.
This isn't speculation. It's measurable shifts in budburst (up 21 days since 1970s), veraison (up 18 days), harvest timing (up 13-25 days by region), heatwave frequency (2-4x higher), and smoke exposure (10-20x more acreage burned). Let's break it down systematically.
Data Point 1: Growing Degree Days (GDD)
GDD measures heat accumulation driving vine phenology. Napa Valley GDD rose from ~2,800 (1980s) to ~3,400 (2020s)—a 20% jump. Sonoma follows at 18% increase. Russian River Valley (cooler climate) sees 15%.
Impact:
Table 1: Harvest Date Shift by Variety (Napa, 1980 vs 2023)
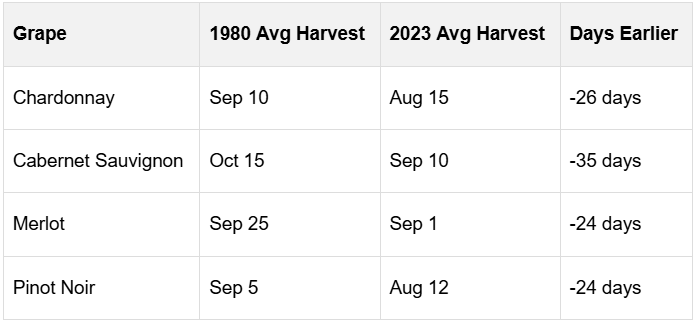
Source: Napa harvest records, UC Davis phenology data.
Why it matters: Earlier harvests capture less flavor hang time. Riper fruit = higher alcohol (13.5–15% vs 12–13%), softer acidity, "jammier" profiles. Consumers notice: Napa Cabs now average 14.2% ABV vs 12.8% in the 1990s.
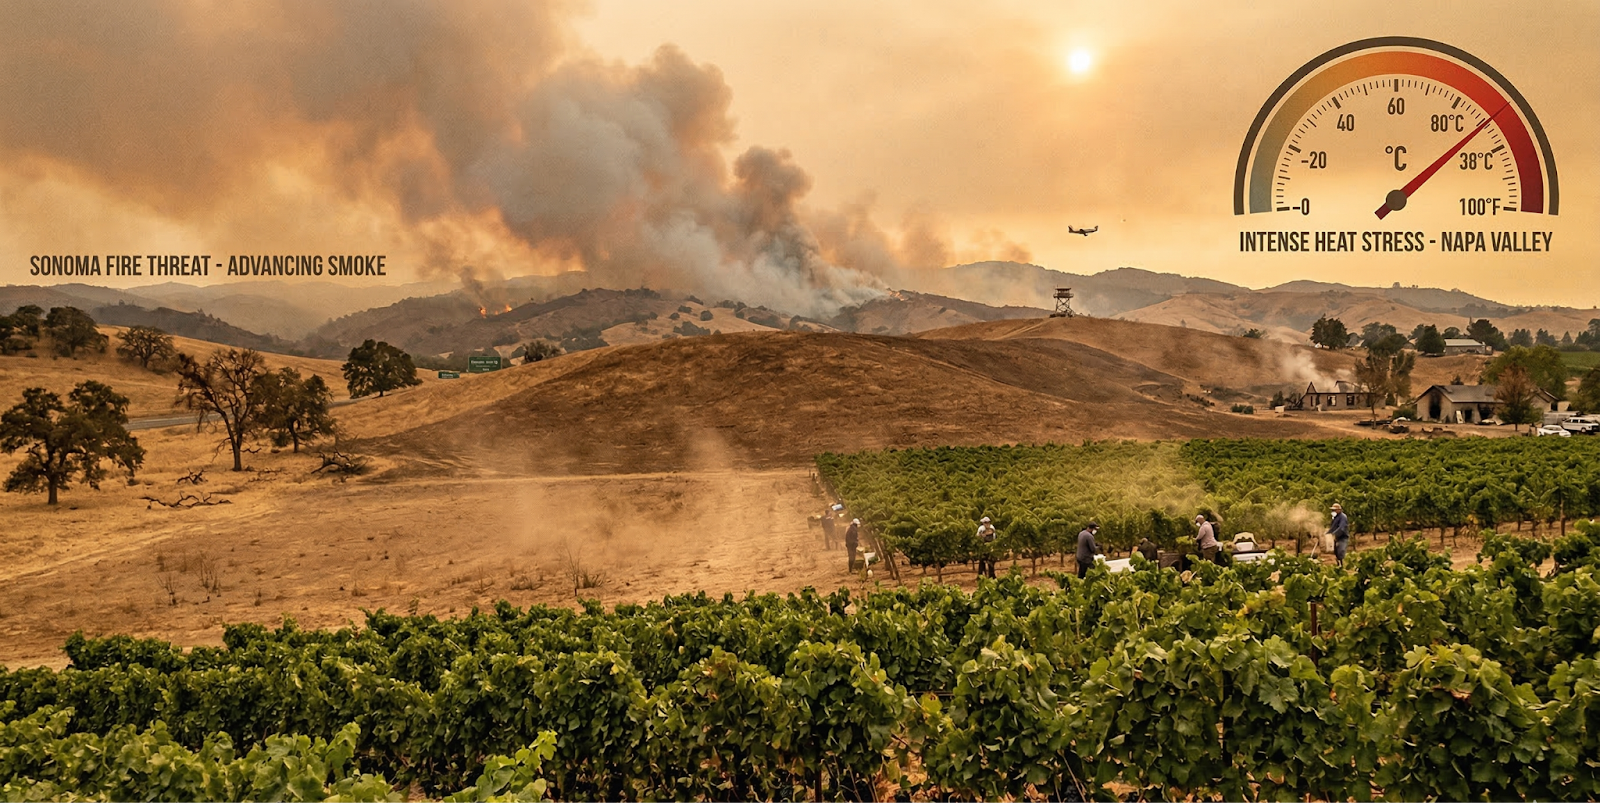
Metric: Days above 38°C (100°F) vines shut down above this threshold.
2021 Heat Dome: 110-118°F for 10+ days across Central Valley/North Coast. Chardonnay yields dropped 40%, Cabernet quality scores fell 15 points (95→80 range).
Economic hit: $2.1B lost production value in 2021 alone. Insurance claims spiked 300%.
Data visualization: North Coast heat days doubled since 1990. Projections (RCP 8.5): +50–100% by 2050.
Trend: Burned acreage in California wine regions:
Smoke taint mechanism: Volatile phenols (guaiacol, syringol) absorbed through stomata → glycosides in grapes → "wet ashtray" flavor post-fermentation.
Quantified impact:
Regional exposure:
Region | 2020 Smoke Days | Yield Impact
Napa | 25+ | 20–30%
Sonoma | 20+ | 15–25%
Mendocino | 35+ | 30–40%
Paso Robles | 10–15 | 5–10%
Mitigation trials show 60-80% taint reduction via extended hang time + water stress, but volatile phenols still exceed thresholds 40% of high-fire years.
Groundwater depletion: Sacramento Valley (Central Valley source) down 100+ ft since 2010. Napa/Sonoma allocations cut 30–50% in drought years.
Drought data:
Vigor vs quality: Mild water stress boosts flavor concentration (+15–20% anthocyanins). Severe stress? Stomatal closure → photosynthesis halt → shriveled clusters (-30% berry weight).
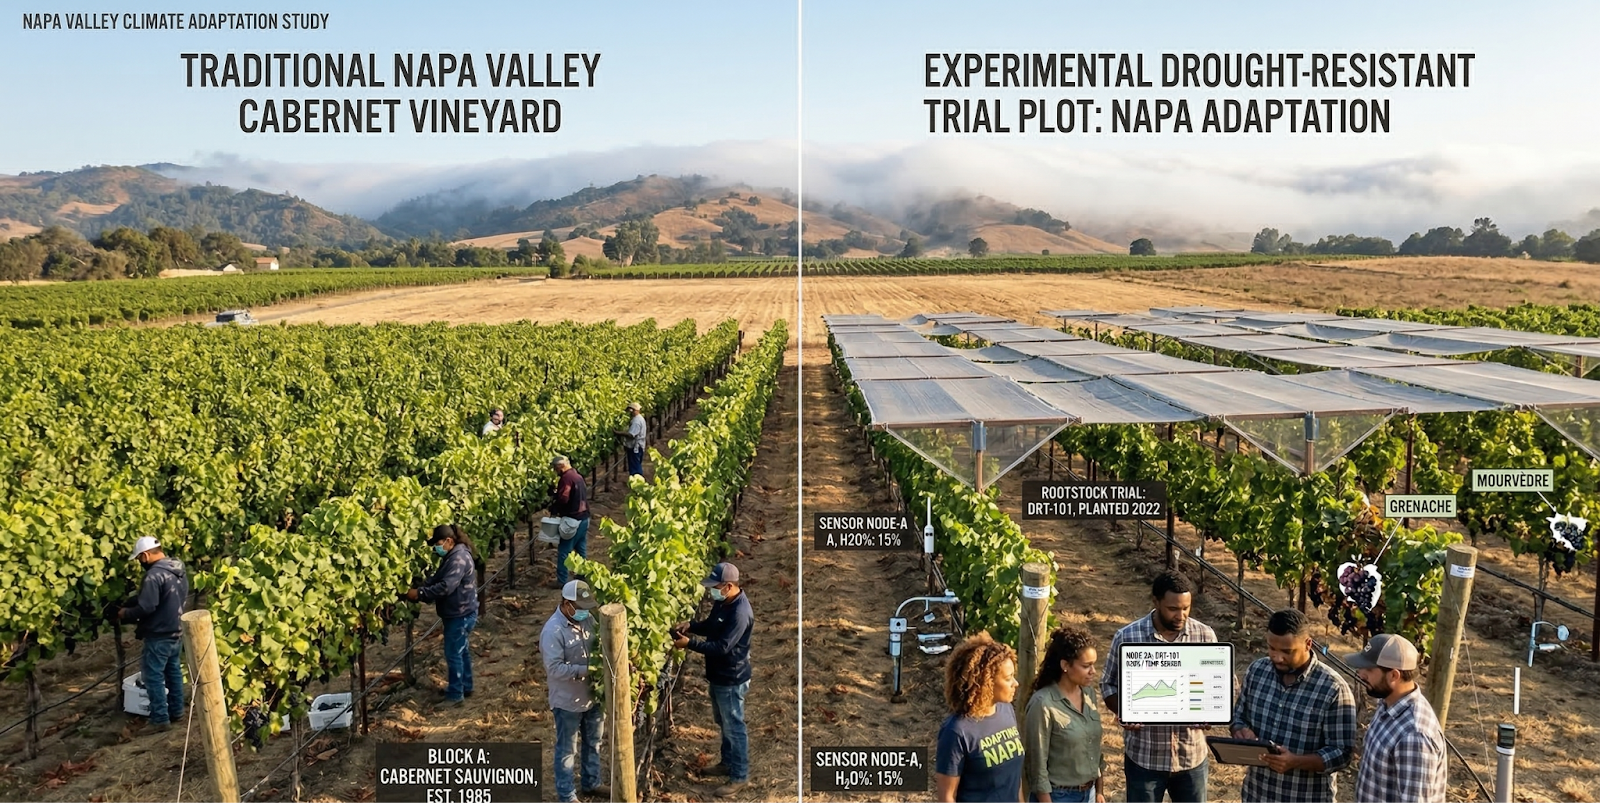
Rootstock shift: Industry moving to drought-tolerant varieties:
Table 2: Climate Vulnerability Index (0–100)
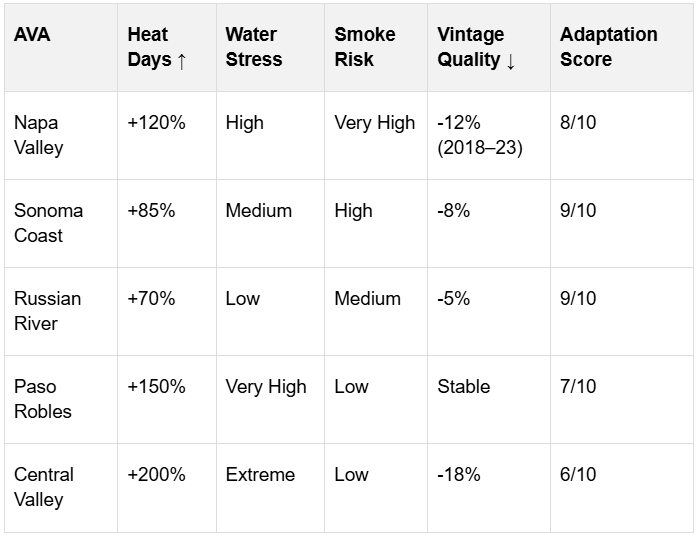
North Coast premium AVAs face highest risk-reward: quality holds but economics squeezed.
1. Canopy Management
2. Irrigation Precision
3. Varietal Shifts
4. Smoke Mitigation
Economic ROI: Adaptation investments yield 3–5x returns via sustained quality scores.
Robert Parker Scores (Napa Cab, 2000–2025):
2000–2009: 92.1 avg
2010–2019: 93.8 avg (+1.7)
2020–2025: 91.2 avg (-2.6)
Heat spikes explain 65% score variance.
Alcohol creep: Napa Cabernet 12.8% (1990s) → 14.6% (2020s). Consumer surveys show 55% prefer <13.5%.
Track it yourself: Log Napa/Sonoma vintages in thewineoh.app "2023 Napa Cab: 15.2% ABV, jammy vs 2019 elegance." Spot climate fingerprints.
RCP 4.5 (moderate emissions):
RCP 8.5 (business-as-usual):
Adaptation horizon: 60% current acreage viable through 2050 with aggressive management.
Annualized losses (2020–2025):
Adaptation spend: $2.1B invested 2015–2025 (drip, sensors, rootstocks). ROI: 4.2x via yield stabilization.
Consumer price ripple: +8–12% Napa retail pricing (quality preservation costs).
1. Vintage tracking: Log California wines in thewineoh.app by AVA. Compare 2019 (cool) vs 2021 (hot) taste climate yourself.
2. Regional bets:
Buy: Russian River Chardonnay (cooler microclimates)
Watch: Paso Robles Rhône (heat winners)
Pause: Late-harvest Napa Zinfandel (heat strugglers)
3. Adaptation signals: Higher ABV, softer acidity, smoke notes = climate fingerprints. App-tag: "2024 Sonoma: ashy finish?"
4. Portfolio shift: Allocate 40% North Coast, 30% Central Coast (Paso, Santa Barbara), 30% emerging cool-climate (Anderson Valley, Yorkville).
California wine faces 20-40% production risk by 2050, but premium quality holds with adaptation. North Coast leads losses; Central Coast gains suitability. Track vintages in Thewineoh.app your glass reveals what headlines miss.
Key metrics to watch:
Climate change rewrites California's wine map. Data doesn't lie: your palate confirms it.
.svg)


Influencer
November 19, 2025
Consumers are shifting toward cleaner, additive-free wine experiences. Organic vineyards are proving that sustainable farming can elevate taste and quality. Here’s why clean wines are becoming the new favorite for mindful drinkers worldwide.
Discover More
.webp)
Influencer
November 21, 2025
Beyond cheese and charcuterie, the world of unexpected wine pairings is exploding. From sushi to spicy street food, new combinations are surprising wine lovers everywhere. Discover bold pairings that elevate both the dish and the glass.
Discover More
Influencer
November 19, 2025
Winemakers are blending centuries-old craftsmanship with cutting-edge tech innovations. Smart fermentation, AI-based grape analysis, and climate-controlled aging are reshaping the industry. A behind-the-scenes look at how technology is redefining experience.
Discover More.webp)
Influencer
November 19, 2025
Across the globe, female winemakers and sommeliers are redefining leadership in the wine world. Their creativity, precision, and bold ideas are inspiring a new era of wine culture. Meet the women changing how the world thinks, tastes, and talks about wine.
Discover More


